
Levo guides · Memory, CPU and GPU
What is memory pressure on a Mac?
Memory pressure is the graph at the bottom of Activity Monitor's Memory tab. It shows how hard macOS is working to keep your apps in RAM: green means easy, yellow means it is compressing and swapping, red means it is struggling. It is a better health check than how much memory is "used".
| Colour | What macOS is doing | What you do |
|---|---|---|
| Green | Enough free and cached memory. Little compression. | Nothing, even if "Memory Used" looks high. |
| Yellow | Compressing memory and starting to swap to the SSD. | Quit something idle. Watch whether it drops back. |
| Red | Heavy swapping. Apps may beachball or macOS may ask you to quit some. | Quit the biggest idle app now, then find the cause. |
How the graph works
The graph combines three things: how much memory is free, how much macOS has had to compress, and how much it pushes out to swap. It is a measure of effort rather than of size. Two Macs can both show 90% used, one calm and green because the memory is mostly cache, the other red because the memory is mostly apps.
Compression is the first line of defence. macOS shrinks pages nobody has touched recently and keeps them in RAM, which is much faster than swapping to disk. That is why the Compressed figure rises before swap does. A high Compressed number on its own is fine. A rising Swap Used alongside a yellow graph is the real sign.
How to check it yourself
- Open Activity Monitor and click the Memory tab.
- Read the Memory Pressure graph at the bottom. Judge it over a few minutes of normal work, not a single second.
- Beside it, read App Memory, Wired Memory and Compressed. App Memory is what your apps hold; Wired cannot be compressed or swapped.
- Sort the table by Memory to see who holds it.
In Terminal:
memory_pressureThe last line reports the system-wide free percentage. Higher is better, and below about 20% the graph usually turns yellow.
If pressure is only yellow while you export a video or run a big build, and drops back afterwards, that is the Mac doing its job. Worry when it stays yellow or red with nothing heavy running.
Why high "used" is fine
Empty RAM does nothing, so macOS keeps recently used files in it. When an app needs memory, the cache is dropped instantly. This is why quitting an app does not always make Memory Used fall much, and why "free RAM" buttons are mostly theatre. Pressure is what tells you whether apps are actually being squeezed.
Read it in Terminal
The graph is a summary, and Terminal lets you look at what sits behind it. These four commands cover most questions:
memory_pressure
vm_stat
sysctl vm.swapusage
top -o mem -l 2 -n 8 | tail -n 12
memory_pressure ends with the free percentage. vm_stat shows pages free, compressed and paged out, and a "Pageouts" number that keeps climbing is the clearest sign of real squeezing. sysctl vm.swapusage shows total, used and free swap. top shows who holds the memory.
What to do at each colour
- Green: do nothing. Resist installing a cleaner for a problem you do not have.
- Yellow for a few minutes: note what you were doing. A video export, a build or a big photo import explains it.
- Yellow that stays: sort by Memory, quit the biggest idle app, and recheck in a minute.
- Red: save your work, quit the biggest app, and consider a restart if red returns right away.
Pressure is shared across everything on the Mac, including helper processes you never see in the Dock. When the graph and the visible apps disagree, switch on View › All Processes and look again.
How Levo does it
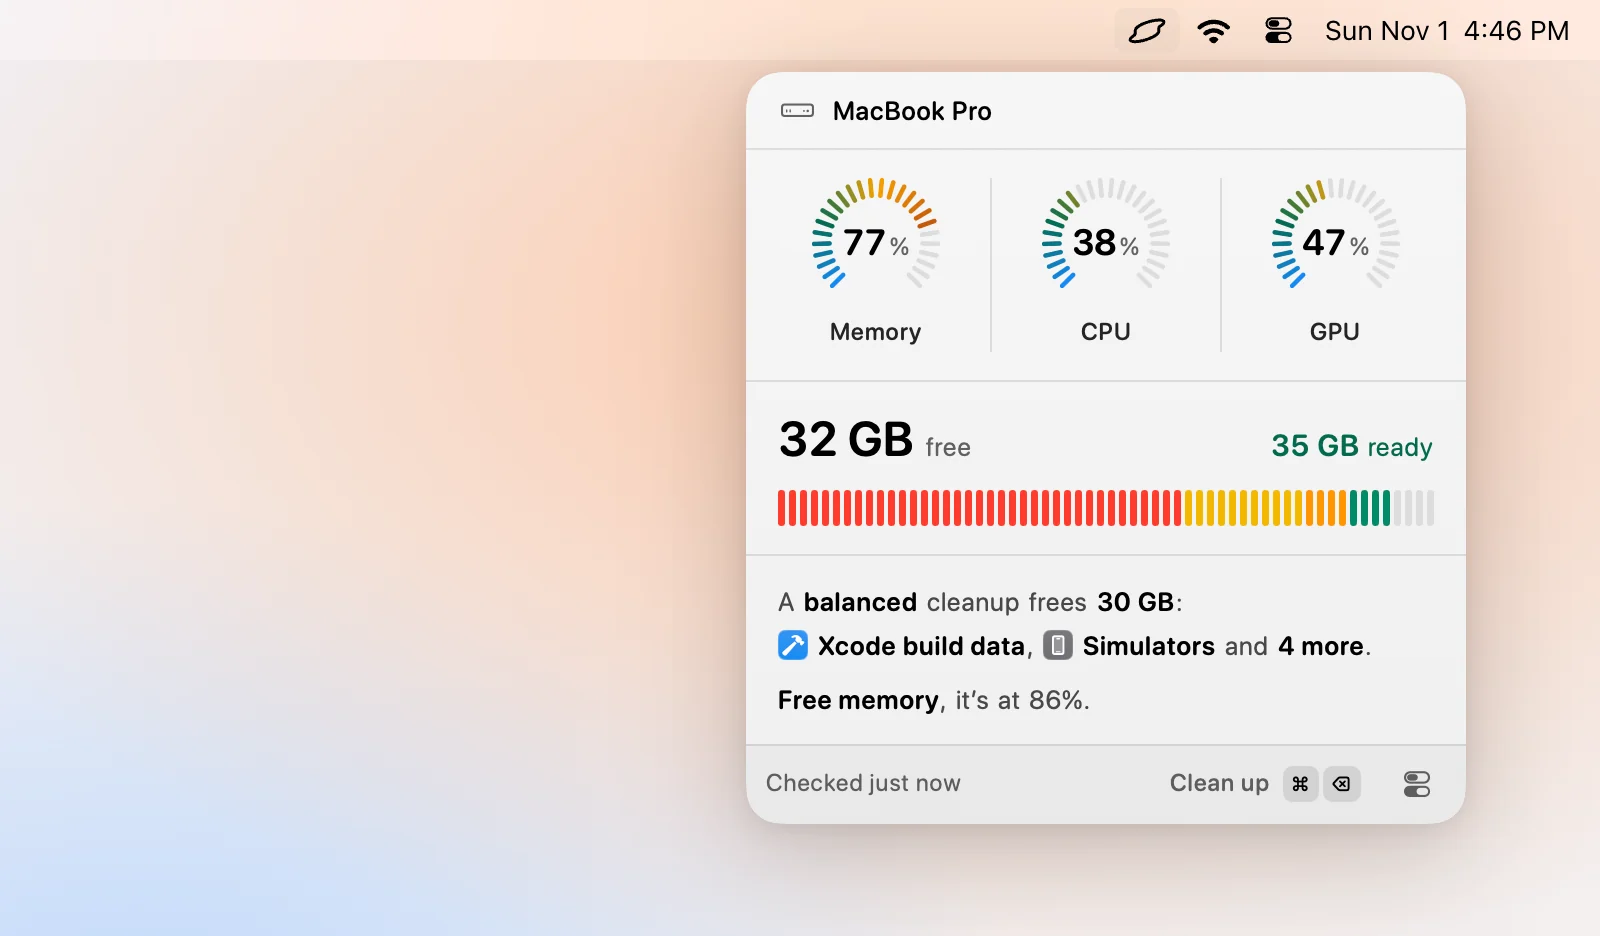
Levo's memory limit uses pressure too, not the used figure. You choose a level to cross, Warning for when macOS is squeezing memory or Critical for when apps may stall, and a time it must last, so a short spike is ignored. When it crosses, the notification already names the biggest idle processes.
Open the popover and click the memory gauge to see the processes behind it. Your own AI agent has judged each one and Levo shows the verdict with a Quit button. System processes are never offered. See free memory, CPU and GPU for the full steps.
FAQ
What is a good memory pressure level?
Green, most of the time. Brief yellow during heavy work is normal. Yellow or red that lasts while you are doing light work means something is holding too much memory.
Is yellow memory pressure bad?
Not by itself. It means macOS is compressing memory and beginning to use swap. If it clears when a heavy task ends, there is nothing to fix. If it stays, quit idle apps.
Why is my memory pressure red with plenty of memory free?
Red with free memory is unusual. Check the Memory tab for a process with a runaway size, and for high Swap Used. A restart resets a leak that a long-running app has built up.
Does memory pressure matter on Apple silicon?
Yes, more than on older Macs, because memory is shared and not upgradeable. The same graph applies, and a Mac with less RAM will sit higher on it under the same workload.
How is memory pressure different from memory used?
Memory used counts cache as well as apps, so it is nearly always high. Pressure measures how hard macOS is working to find room, so it tells you whether apps are really short of memory.
Can I improve memory pressure without buying RAM?
Yes. Quit idle apps and background processes, close heavy tabs, trim login items and restart now and then. If pressure is high even then, your workload has outgrown the RAM.